
Checking Risk Before You Commit
Before you put a trade on, or while you're holding one, three questions matter: how likely you are to come out ahead, what the range of outcomes looks like, and how bad a bad day could get. The Risk Lab answers them. It simulates your positions and shows the key numbers in a Risk Profile, the range of outcomes as a cone, and lets you test what-if changes without touching your real book. Open it from the top navigation.
Important
The Risk Lab is a model: a simulation of what might happen, not a forecast of what will. VolNinja never gives trading or financial advice. Treat its numbers as guidance, not direction: a way to weigh your own decision, never a recommendation to trade, a guarantee, or an opinion on what you should do. Real markets move outside any model's expectations, and every decision is yours.
The numbers at a glance
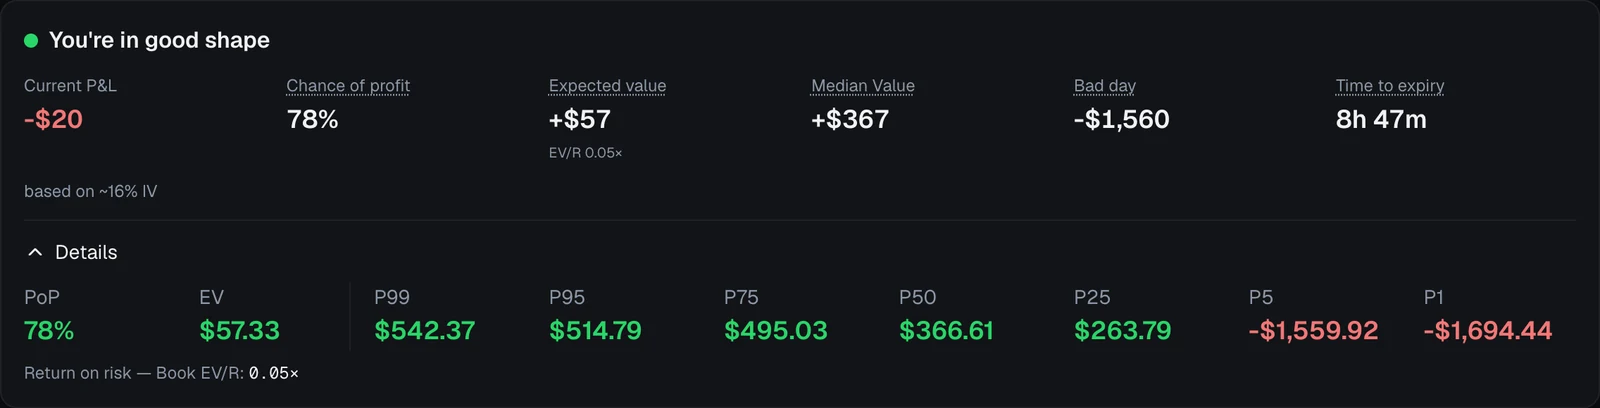
At the top sits the Risk Profile card, with the numbers that answer those three questions:
- Current P&L — where you stand right now.
- Chance of profit — how often the simulated outcomes finish above break-even.
- Expected value — the probability-weighted average outcome (your long-run edge); the EV/R figure compares it to your downside.
- Median Value — the middle outcome.
- Bad day — a rough but plausible loss; only about 5% of outcomes are worse.
- Time to expiry.
Hover any label to see what it means.

Click Details to unfold the whole range of outcomes at expiry: a ladder from the best case (P99) through the median (P50) to the worst (P1), next to PoP and EV. Reading down it tells you how wide the spread is, not just where the middle sits.
Tip
You don't have to open the Risk Lab to get these numbers. The same Risk Profile card appears on your Dashboard, so a glance shows your chance of profit and bad-day loss whenever you check your positions.
Try a change before you commit
Click What-if and stack up hypothetical actions:
- Open new — add one of your favorite templates, times a quantity.
- Close existing — close a whole position, or a single leg.
Press Done — run it, and the Risk Lab re-simulates with your changes applied. The Risk Profile numbers switch to a now → after view, so you can see how the change moves your chance of profit, expected value, and bad-day loss before you place a single order.
Nothing here touches your real positions; it's a sandbox. Use Clear to return to your live book. When you decide to act for real, you do that from the position itself or by running a template. See Opening & closing positions and Placing a trade.
The bigger picture
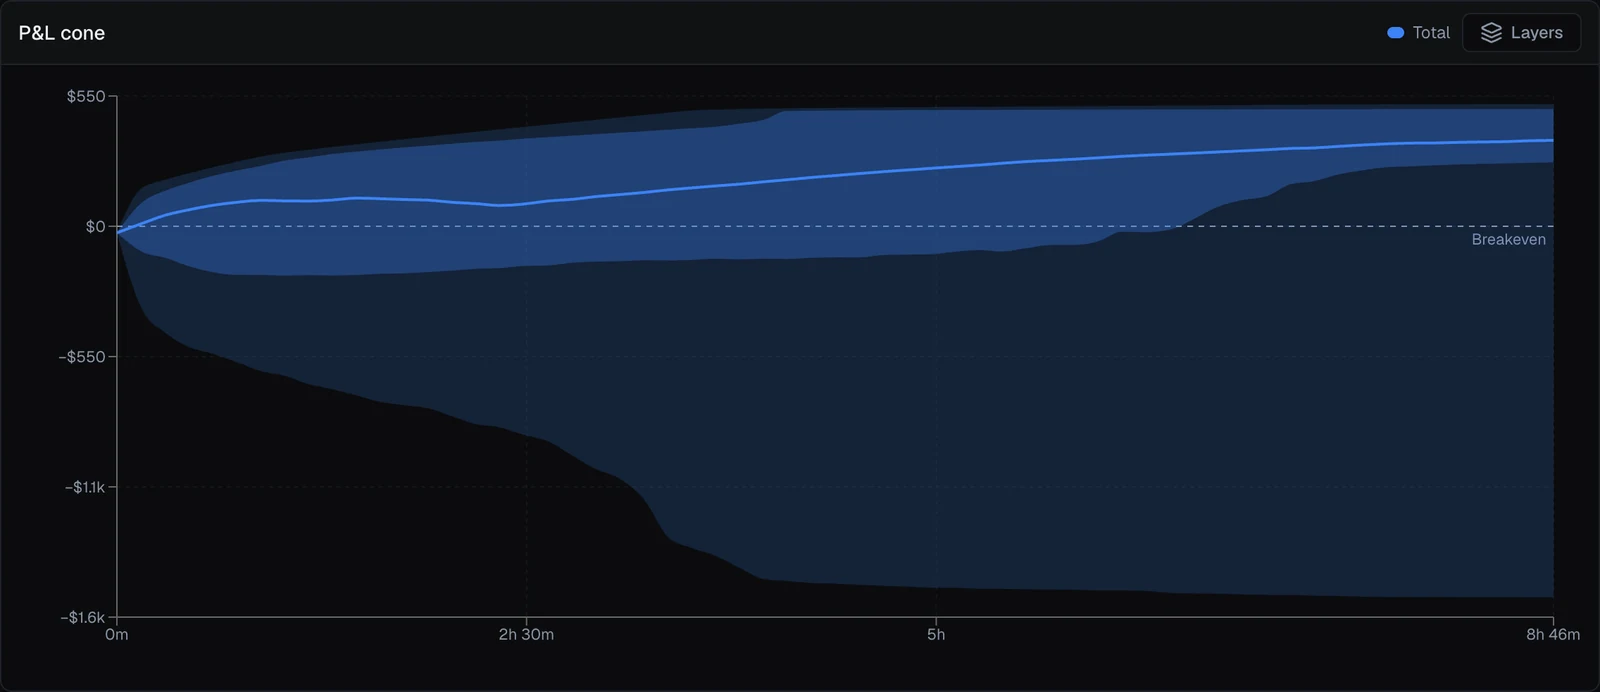
Below the Risk Profile, the Risk Lab plots the full shape of your risk. The P&L cone shows the range of possible paths from now to expiration: time runs left to right, dollars up the side, and the dashed Breakeven line sits at zero. The wider the band below that line, the more room a bad day has.
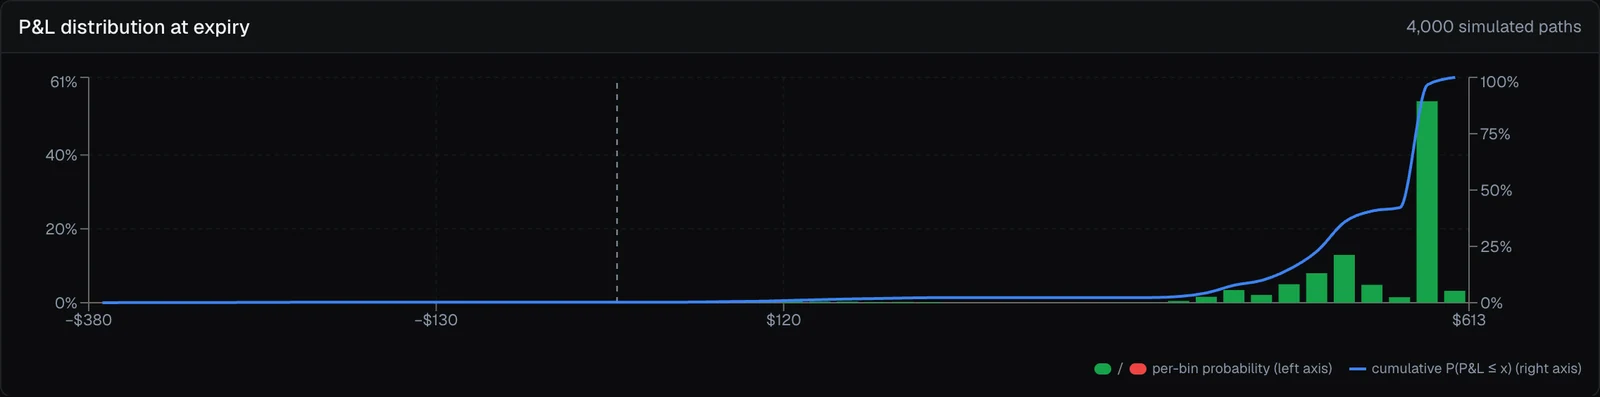
P&L distribution at expiry shows where you could finish: a bar for each range of outcomes (red for a loss, green for a profit), and a rising curve you can read as the chance of ending at or below any level.
The Risk Lab also shows how likely each of your management rules is to fire, and you can narrow every panel to a single position or judge your whole book at once. If the numbers aren't updating, check the Simulation switch at the top of the Risk Lab: it may be paused. For a full tour of those panels, see Risk Lab.
Warning
Because the Risk Lab is a model, healthy-looking numbers are never permission to stop watching. Size and manage every trade as if the market can move against you, because it can. And whatever a scenario suggests, in LIVE mode any real action uses real money. See Paper vs live.