
Risk Lab
The Risk Lab simulates your positions and lays out the full shape of your risk: a Risk Profile of the key numbers, a cone of possible outcomes over time, the distribution of where they land at expiration, and how likely your rules are to fire. It's the deep version of the quick check in Checking risk before you commit.
Important
Everything in the Risk Lab comes from a model, a simulation of what might happen. VolNinja never gives trading or financial advice. Treat it as guidance, not direction: a way to weigh your own decision, never a recommendation to trade, a guarantee, or an opinion on what you should do. Real markets move outside any model's expectations, and every decision is yours.
The header — simulation, live updates, refresh, status
The top of the screen carries the Risk Lab title and three controls:
- Simulation — switches the background simulation itself on or off, for the mode you're in (paper or live). Turn it off to save your computer the work; the label changes to Paper sim · paused (or Live sim · paused) and the numbers stop updating until you turn it back on. The same switches live in Settings → Simulation.
- Live updates — on by default, so the panels refresh continuously. Turn it off to freeze the view and study a snapshot; the simulation keeps running underneath, so you pause the display, not the math.
- Refresh — runs a fresh, high-quality simulation on demand.
Beneath the title, a status row tells you which of these states you're in: Live, Frozen (UI) when you've turned off Live updates, or Paused with the mode when the simulation is off. It also shows how often the simulation runs, how many paths it simulated, and how long ago it last updated. A green dot means fresh numbers.

The positions rail — what you're judging
Down the left is the rail, where you choose what to analyze. At the top, Whole portfolio judges your entire book at once. Below that, the rail lists each open position with its current P&L and, beneath it, its median outcome at expiry (P50). Click one to focus every panel on that trade, or click Whole portfolio to see them all together.
Each position row also has a ⋮ menu of what-if shortcuts: Simulate closing this position and Simulate closing a leg… (Simulate roll… is listed but not available yet). As the menu says, these do not place orders; they add the action to a scenario. The What-if button at the bottom of the rail opens the full scenario builder.
The Risk Profile
At the top of the panels sits the Risk Profile card: the key numbers for whatever you've selected, side by side. They are Current P&L, Chance of profit, Expected value (and EV/R), Median Value, Bad day, and Time to expiry. Hover any label for its definition. A settings gear lets you adjust the assumptions the simulation runs on. The same card appears on your Dashboard. See Checking risk before you commit for a closer look at each number.
It doesn't sum the numbers up into a verdict for you. They're there to weigh, and the judgment is yours.
Details — the full percentile ladder
Click Details to expand the card into the complete outcome breakdown at expiry:
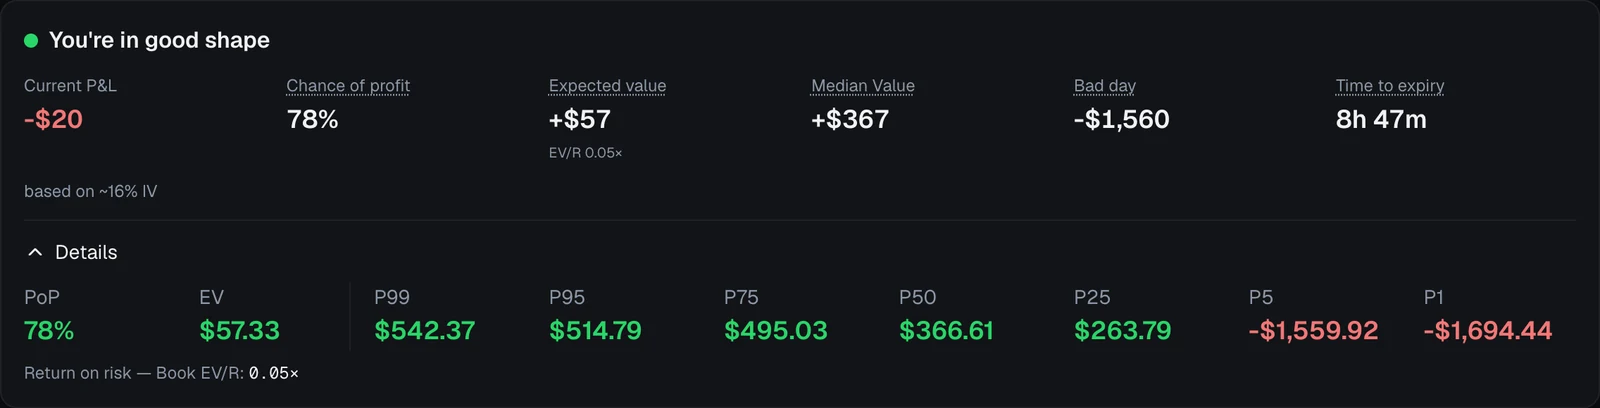
Alongside PoP (chance of profit) and EV (expected value), it lists the P&L at each percentile (P99, P95, P75, P50, P25, P5, P1), read as a ladder from best case to worst. P50 is the median (the same "Median Value" as on the card), P5 is the "Bad day", P95 / P99 are strong-upside outcomes, and P1 is a worst-case, roughly 1-in-100 result. Below the ladder, Return on risk (Book EV/R) gives your expected gain per dollar of downside, both measured from where you stand now. When a what-if scenario is active, each figure gains an amber → showing where your change would move it.
The P&L cone
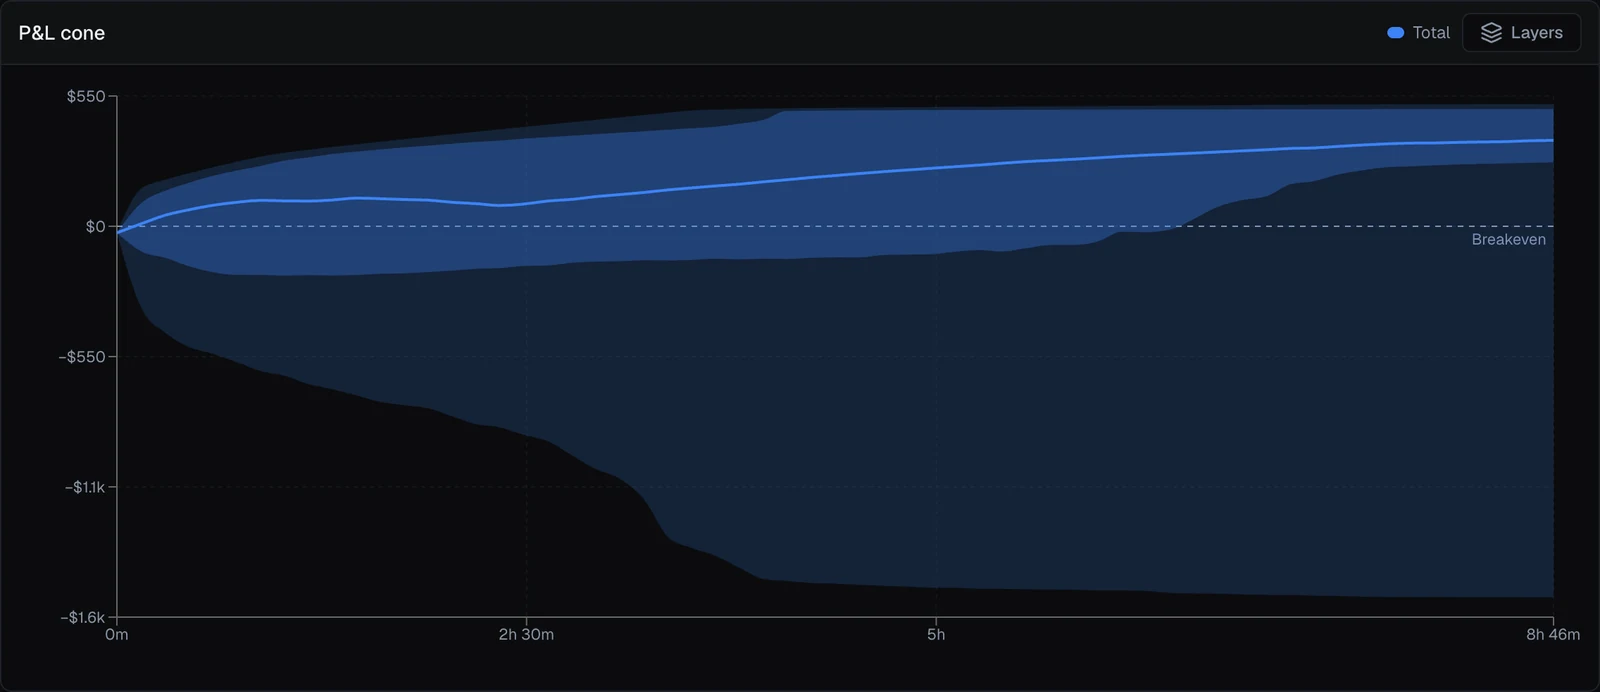
The P&L cone plots the range of profit-and-loss outcomes from now to expiration: time runs left to right, dollars up the side, and a dashed Breakeven line sits at zero. The shaded bands show how outcomes spread around the middle. You can toggle an outer band and the extreme tails on or off from the layers control. The cone narrows toward expiry as uncertainty resolves; as long as it sits mostly above breakeven, most simulated paths are winners. Hover anywhere to read the exact percentile values at that moment. When a what-if scenario is active, a second "With what-if added" overlay shows how your change reshapes the cone.
The distribution at expiry
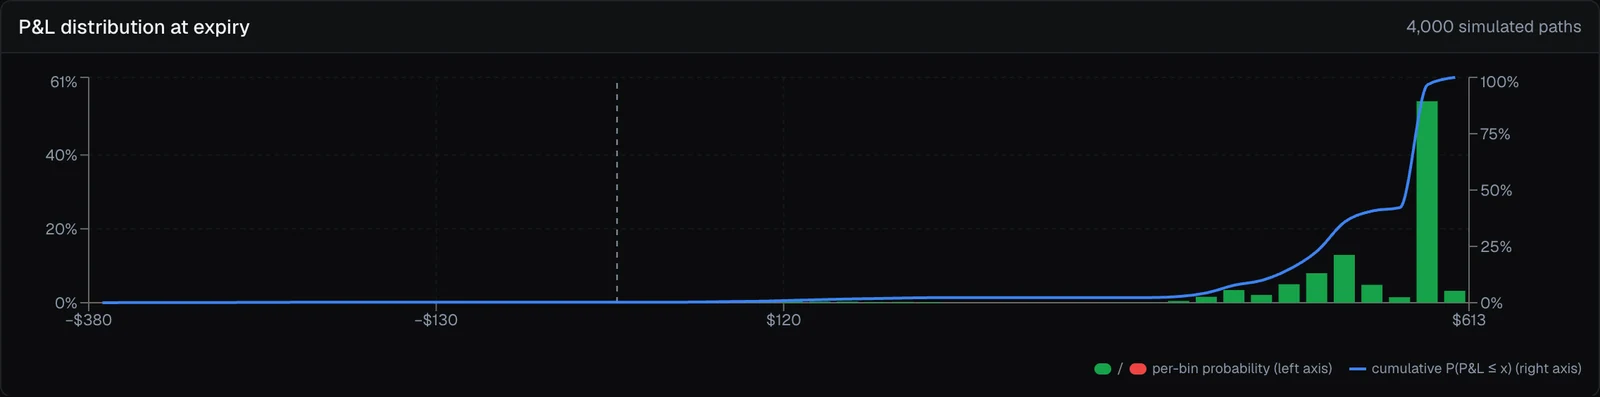
The cone shows outcomes over time; P&L distribution at expiry shows the final ones as a histogram (the full spread of where the position could land at the close), with a rising cumulative curve for reading the odds of finishing at or below any level. Read it for where most of the probability sits and how heavy the tails are: a tall peak above breakeven with thin tails reads nothing like a flat spread with a long downside.
Rule trigger probabilities
When you focus the rail on a single position, a Rule trigger probabilities panel appears. It estimates how likely each of that position's management rules is to fire before expiration: P(rule fires before expiry) across the simulated paths.
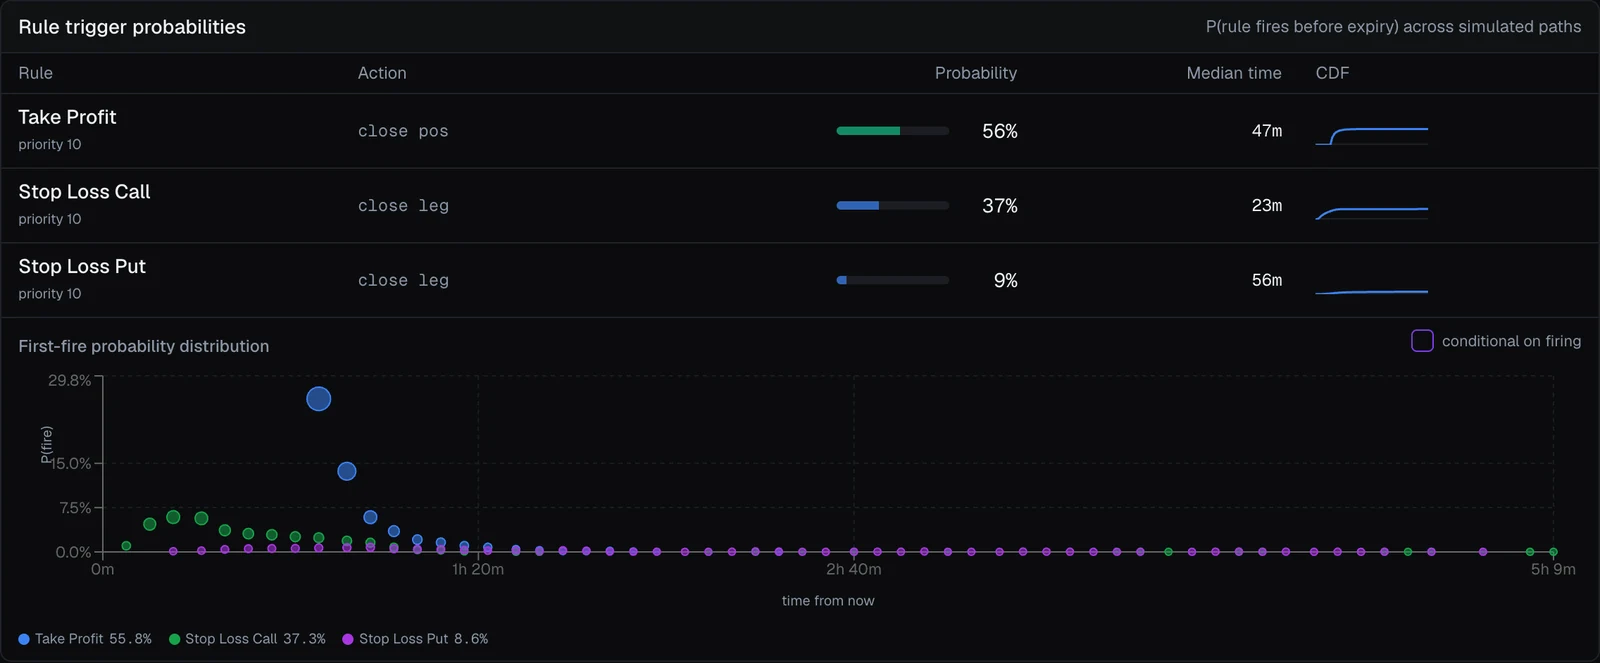
Each rule gets a row with its probability of firing, its median time to fire, and a small CDF sparkline; below the table, a first-fire probability distribution shows when each rule is most likely to trigger across the session. Use it to see whether your take-profits and stops are apt to fire, or whether they sit so far out they rarely matter: a sanity check that your automation lines up with the risk the rest of the Lab shows.
What-if scenarios
Reach the scenario builder from the What-if button or any position's ⋮ menu. It lets you stack hypothetical actions (Open new: add a favorite template times a quantity; Close existing: a whole position or a single leg) and press Done — run it. The Lab re-simulates: the Risk Profile numbers switch to a now → after view and the cone gains its overlay, so you can see how the change moves your odds before you touch anything real. For the full walkthrough, see Checking risk before you commit.
Warning
Nothing in the Risk Lab places an order: the what-if builder is a sandbox. But because it's a model, healthy-looking numbers are never permission to stop watching. When you act for real, you do it from the position or a template, and in LIVE mode that uses real money. See Opening & closing positions and Paper vs live.