
Position Details
Selecting any position on the Dashboard (a row in the table, or a card on a phone) opens the Position Details sheet. This is the full picture of a single position: every leg, its Greeks and pricing, the P&L broken down to the last cent, and the automation attached to it. It updates live while it is open, so prices and P&L move with the market.
The header
The top of the sheet stays visible as you scroll. It shows the position's number (Position #…), a status badge (OPEN, PENDING OPEN, PENDING CLOSE, CLOSED, EXPIRED), and the underlying. On the right is the headline Net P&L for the position, in dollars and as a percentage. Green is profit, red is loss.
Needs review
A red Needs review badge next to the status means VolNinja's record of this position may not match what your broker holds, for example after a fill it could not fully account for. The position's rules keep acting on it. Compare it with your broker, correct any leg that is wrong (see Editing a leg), then select Clear beside the badge to record that you have looked. Clearing does not switch the check off: if the mismatch is still there, the flag comes back.
Tranches
When the position is one tranche of a tranched trade, a line under the header names it and says how many tranches the trade has — Tranche t1 · Front half · 2 of 2 — followed by a link per sibling tranche. Selecting one switches the sheet straight to it, so you can compare the tranches of a trade without going back to the list.
Tabs
Below the header is a row of tabs: Overview, Risk, Rules, and Activity. The sheet opens on Overview. Whatever tab you are on, Close at Market and Close with algo stay pinned along the bottom, so exiting the whole position is one click away. See Opening and closing positions.
Overview
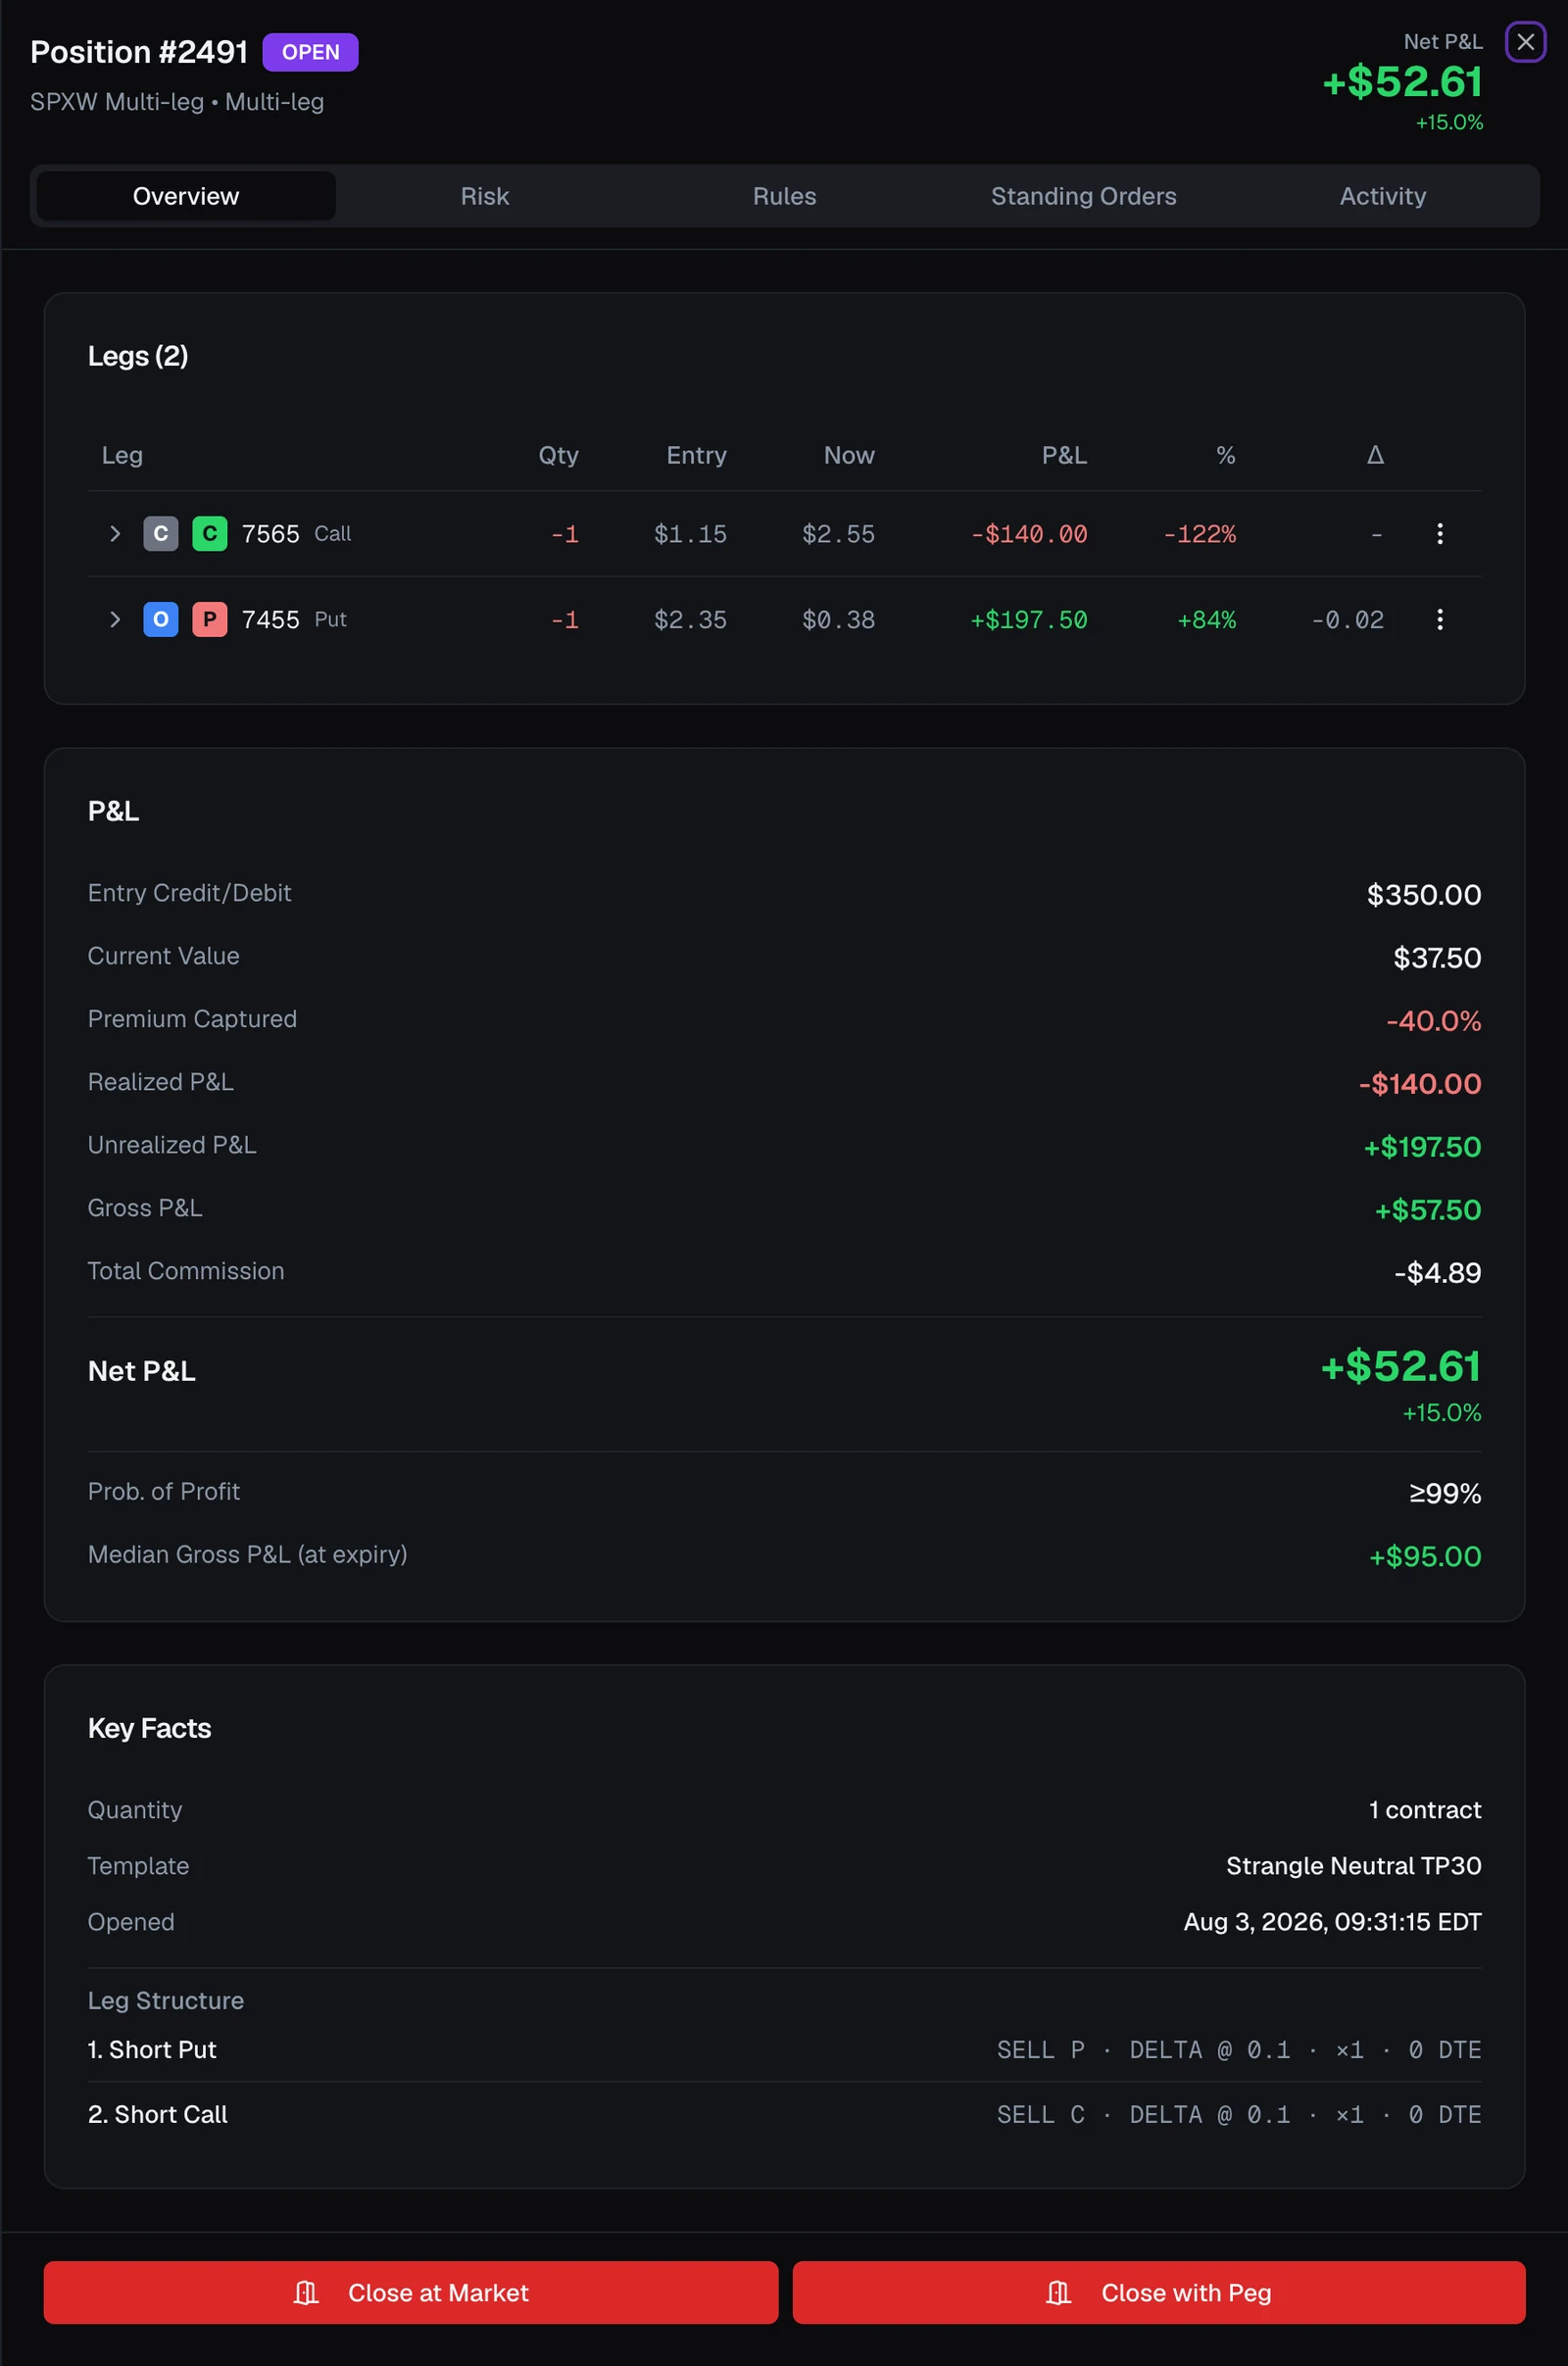
The Overview tab covers what the position is and how it is doing right now, across three cards.
Legs
The Legs card lists every leg of the position, sorted by strike. Each row shows a status letter (O open, C closed, P pending, R rolled, E expired, X cancelled), a C (call) or P (put) tag with its strike, the signed quantity, the entry price, the current price (Now), the leg's P&L and percentage, and its current delta (Δ).
Each row also has a ⋯ menu on the right. For an open leg it lets you edit the leg, Roll Leg… it to a new strike (see Rolling a leg), or close that one leg (Close at Market or Close with algo) without touching the rest of the position. The same actions appear as buttons when you expand the leg (below). See Close a single leg.
Select a leg row to expand it. Two more panels appear:
- Greeks (entry → current) — Delta, Gamma, Theta, and Vega, shown as the value at entry and where it is now, so you can see how each Greek has drifted.
- Pricing & Details — the live Bid / Mid / Ask, exit price for a closed leg, expiry (with days to expiration), commissions, number of rolls, and the contract symbol.
P&L
The P&L card breaks the bottom line down step by step: Entry Credit/Debit, Current Value, Premium Captured, Realized P&L, Unrealized P&L, Gross P&L, Total Commission, and the emphasized Net P&L. When the outlook simulation has data, two forward-looking figures appear below: Prob. of Profit (the chance the position finishes profitable) and Median Gross P&L (at expiry) (the middle of the range of outcomes). For a richer, interactive view of these probabilities, use the Risk tab (see Risk Lab).
Key Facts
The Key Facts card carries the position's identity and timing: Expiration (with DTE), Quantity, the Strategy that owns it, the Template it came from, when it was Opened and Closed, and the Close Reason. When the position was created from a template, its original Leg Structure (the configured selectors and ratios) is listed here for reference.
Changing a position's strategy
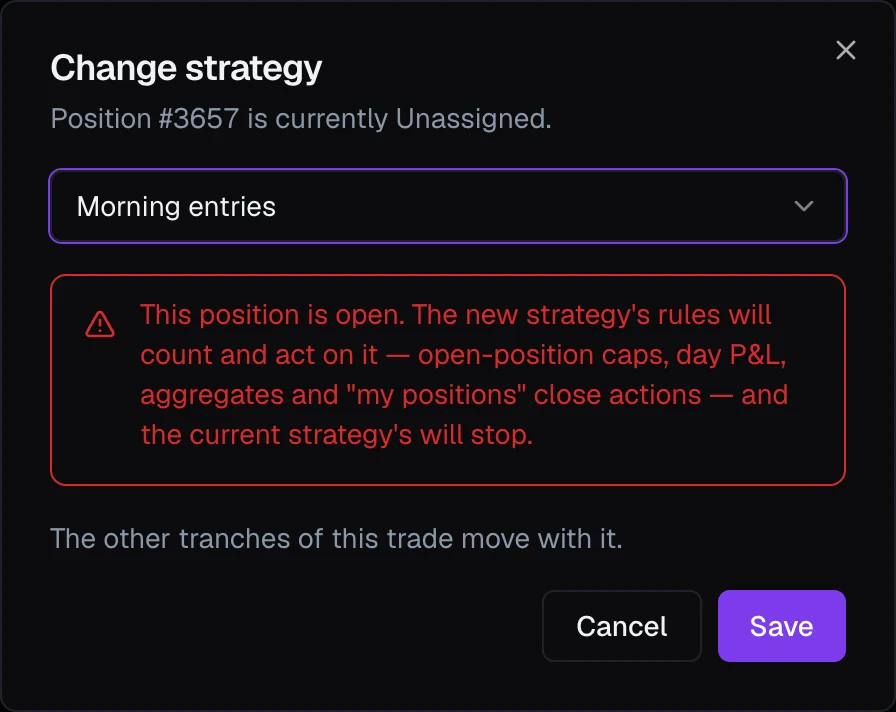
The Strategy row names the strategy the position belongs to: a strategy's name, Unassigned for a position no strategy owns (one you opened yourself, by template, through the API, or by recording it), or Deleted strategy when its strategy no longer exists. Select Change to reassign it, pick a strategy (or Unassigned) in the Change strategy dialog, and Save. This is how you hand a manually opened trade to a strategy, or take one back.
On an open position the dialog warns you what that means: the new strategy's rules start counting and acting on the position (its open-position limits, its day P&L, its aggregates, and any "close my positions" actions), and the old strategy's stop. On a tranche, the other tranches of the same trade move with it. Change is not offered while the position is still opening or closing.
Editing a leg
Every leg has a ⋯ menu (and an Edit button in its expanded view). Choose Edit to open the Edit Leg sheet, where you can correct a leg's Action, Right, Strike, Status, Entry Price, Exit Price, and entry/exit Commissions, then Save Changes.
Editing corrects a position's record, for example fixing an entry price or marking a leg closed with the right exit price. It does not place any orders. Because these values feed the position's P&L, changing them recalculates it: the sheet warns you when a status change to closed or expired will do so. You cannot edit a pending leg, one that has not yet filled.
Important
Editing a leg changes the numbers VolNinja records for the position, not the position at your broker. Use it to keep your records accurate. To move the market position, close or adjust the leg.
Closing a single leg
From the same ⋯ menu (or the buttons in a leg's expanded view) you can close an individual leg, for example taking off one side of a strangle while leaving the other on. You choose Close at Market for an immediate fill or Close with algo to work the order, then confirm on a dialog that shows the leg, its current bid/ask/mid, and the estimated P&L.
Warning
Close at Market and Close with algo submit real orders to your broker. Always confirm your trading mode first, and never submit test orders while you are in live mode. For closing a whole position, and for split/expire/bulk actions, see Opening and closing positions.
Risk
The Risk tab is the full risk workbench for this one position: the same analysis the Risk Lab runs across your whole book, narrowed to this trade. It is live while the position is open. A closed or expired position has no forward-looking outlook left to simulate, and the tab says so.
The numbers come from a portfolio simulation that runs in the background, one per trading mode. If you have paused it (see Risk Lab), the tab shows a Simulation paused card instead of the panels, with Resume to restart it and Update now for a one-off run. If the simulation is running but has not produced numbers for this position yet, the card reads Waiting for the next simulation. When the panels are showing a snapshot from a paused simulation, a caption above them says Numbers are frozen — the simulation is paused.

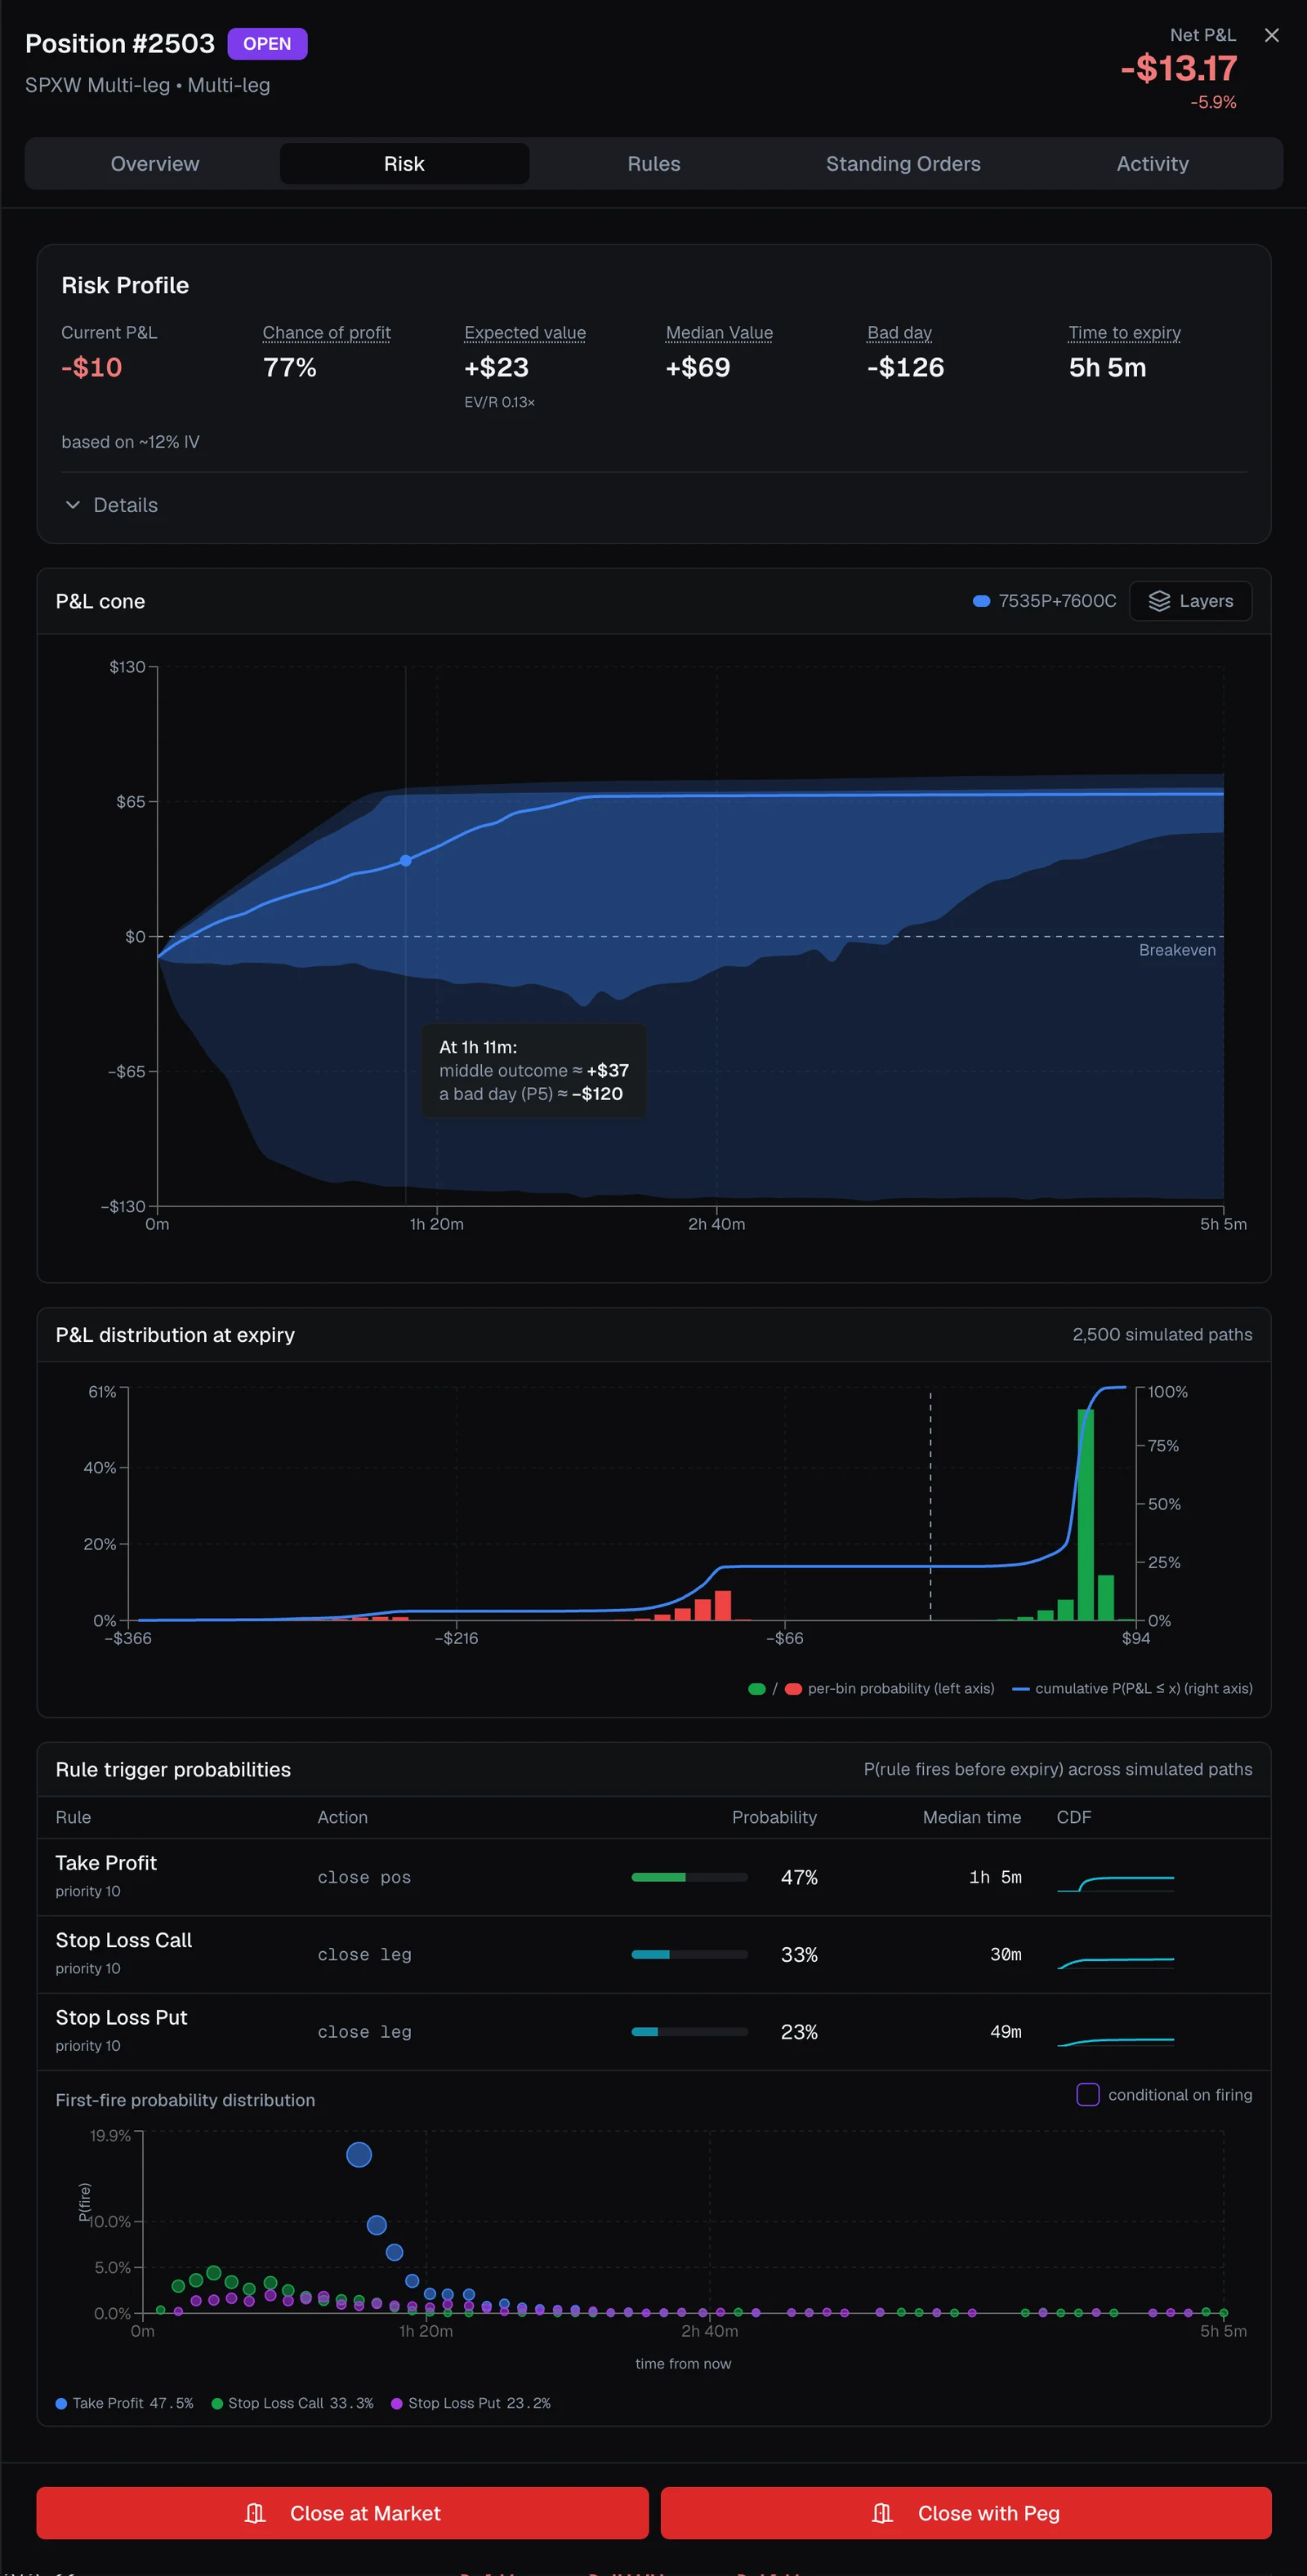
The tab has four panels, top to bottom:
- Risk Profile — the same headline read as on the Dashboard: Current P&L, Chance of profit, Expected value, Median Value, Bad day, and Time to expiry, with the implied volatility behind them. Details expands the percentile ladder.
- P&L cone — the range of outcomes for this position from now to expiry: the middle line is the median path, the shaded bands are the likely range, and the dashed line is breakeven. Hover anywhere on it to read that moment's middle outcome and bad-day figure. Layers switches between the position total and its individual legs.
- P&L distribution at expiry — where those simulated paths end up. Bars are the chance of each outcome (green profit, red loss); the curve is the cumulative probability of finishing at or below a given P&L.
- Rule trigger probabilities — for each rule attached to this position, how likely it is to fire before expiry, the median time until it does, and the shape of that timing. The First-fire probability distribution below plots which rule is most likely to act first, and when.
Tip
Use the rule-trigger panel as a sanity check on your automation: if a stop loss is nearly certain to fire within the hour, or a take-profit almost never fires, your levels are probably in the wrong place.
The same panels, plus what-if sliders across your entire book, live in Risk Lab.
Rules
The Rules tab holds the automation attached to this one position: the rules that will manage or exit it. Each rule carries a badge saying where it runs right now: standing at broker, as a real stop or limit order resting at Interactive Brokers that holds even when VolNinja is not running, or runs in app, checked by VolNinja while it is running. A separate article walks through adding, reading, and pausing them: Automating a position. For what decides where a rule runs, see Where rules run: broker vs app; Rules and conditions explains how rules and conditions work in general.
Activity
The Activity tab is the position's history, newest first: everything VolNinja did and why. Each entry is one episode: its title (Position Entry, Rule Triggered: Stop Loss Call, a close), badges for the rule and order type involved, the timestamp, and how many steps it took.
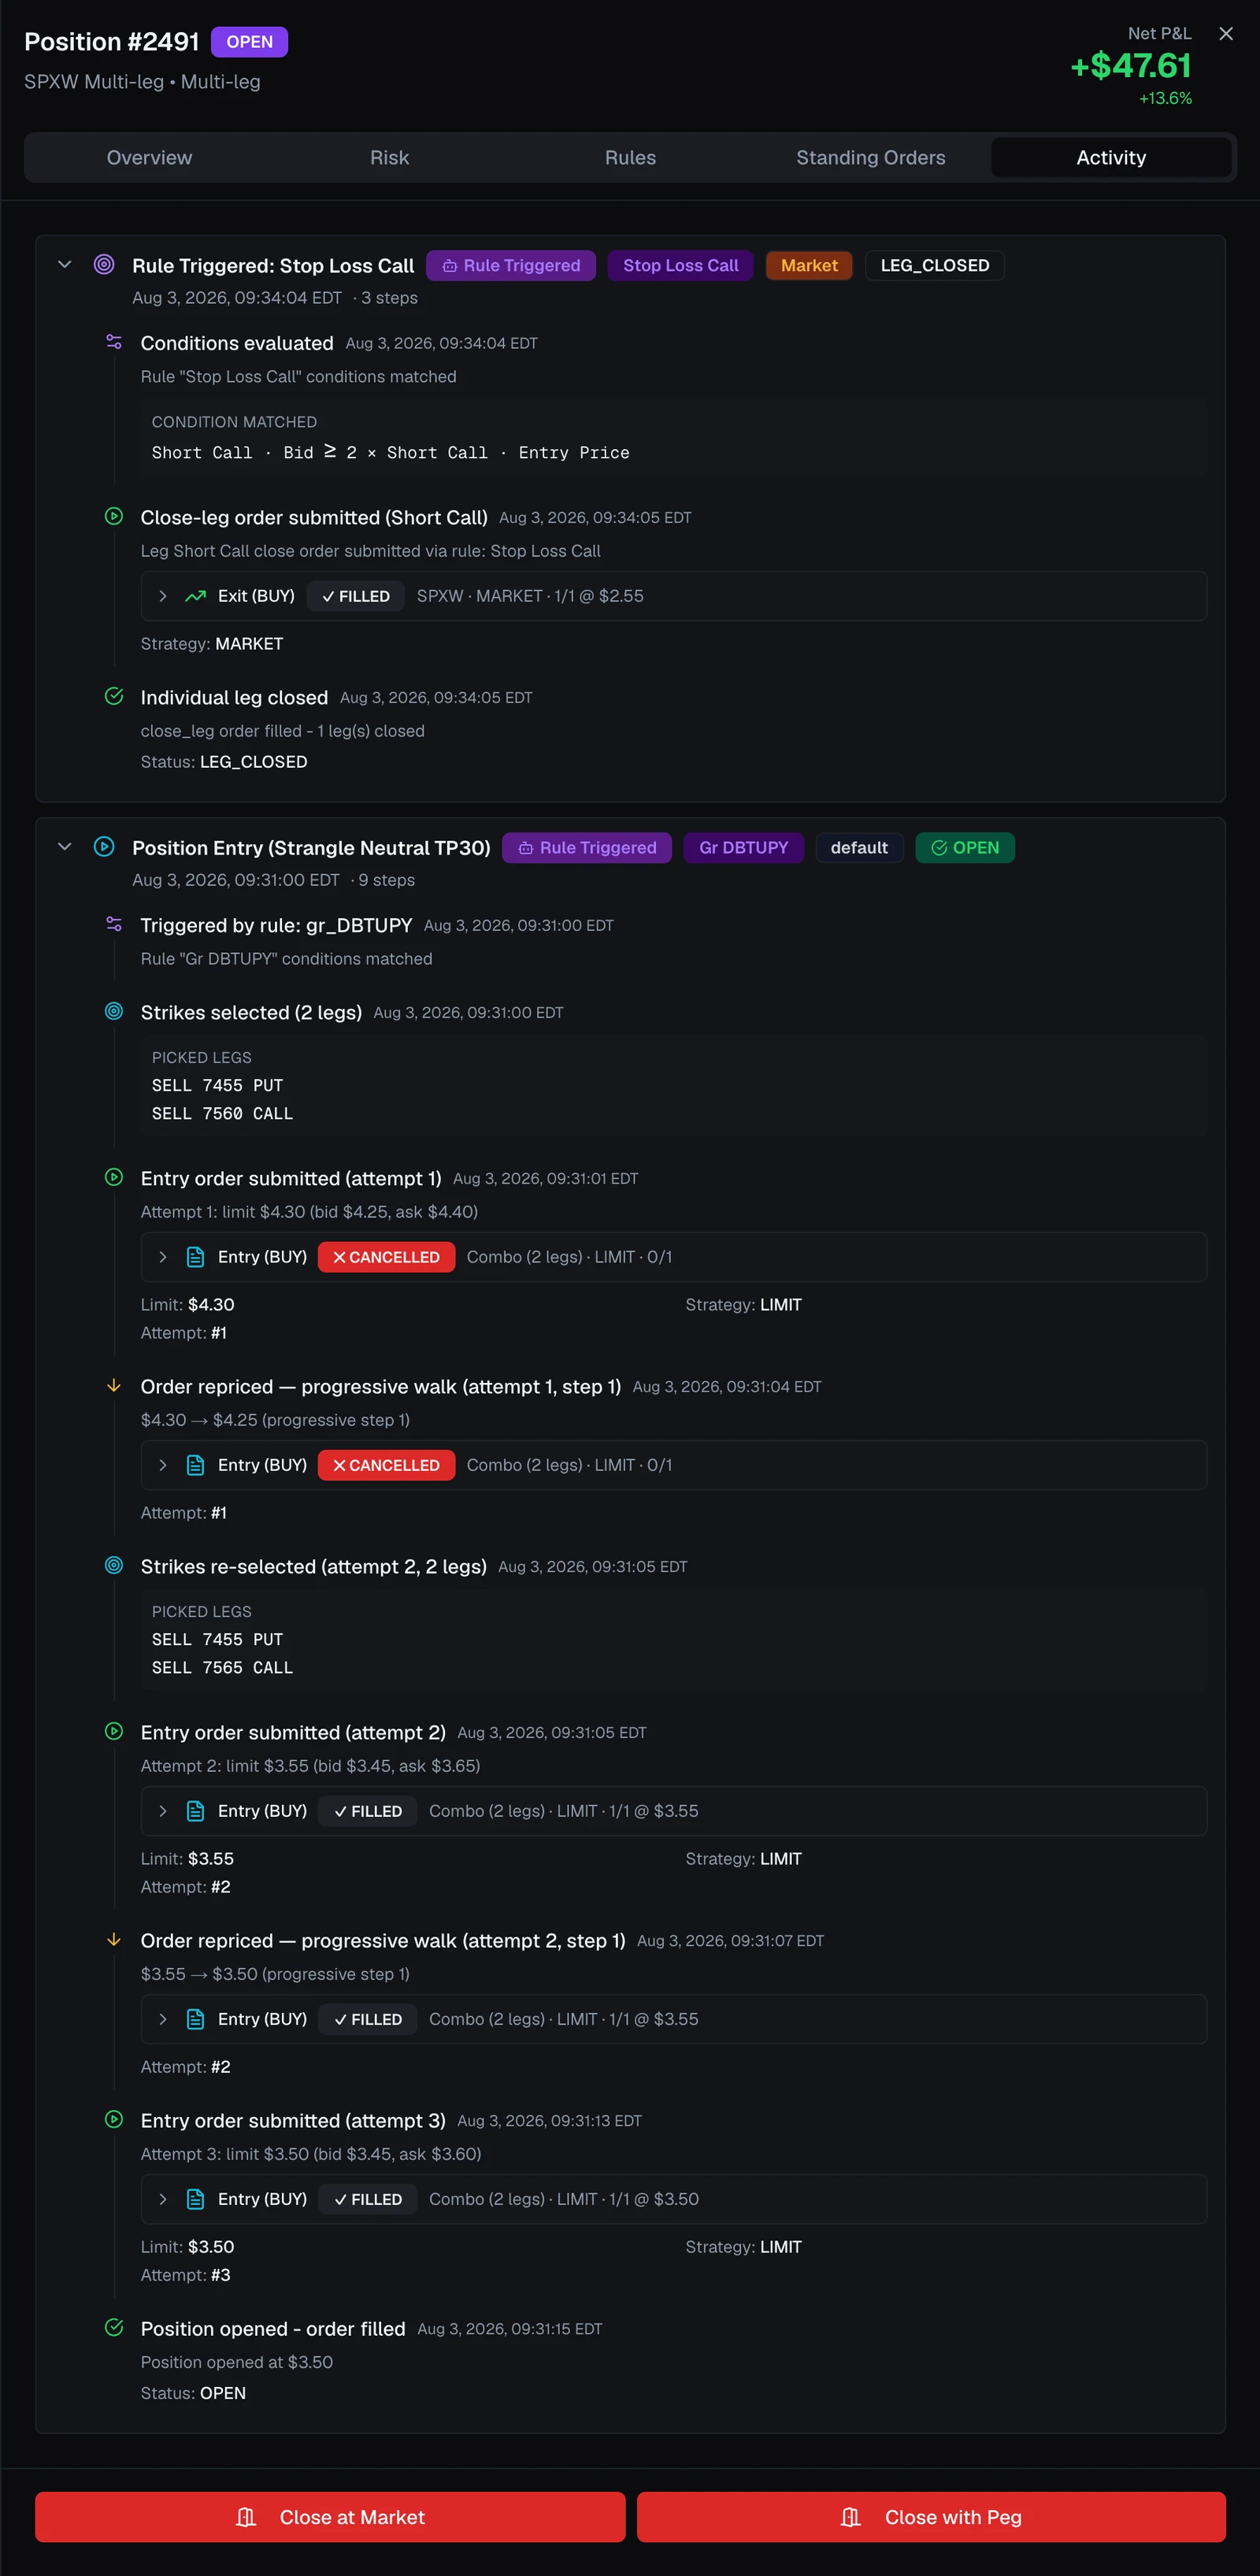
Expand an episode and you get the reasoning, step by step:
- Which conditions matched — the exact expression that fired, such as Short Call · Bid ≥ 2 × Short Call · Entry Price.
- Which strikes were picked, and re-picked if the market moved between attempts.
- Every order, with its type, limit, and outcome (FILLED, CANCELLED), quantity, and price.
- Each repricing step as an order was worked, showing the price walking from one level to the next.
- The result — the position opened, a leg closed, the position closed.
This is the first place to look when you want to know why a position opened where it did, why an entry took three attempts, or what a rule did on your behalf.
Where to go next
- Positions overview — the Dashboard the details sheet opens from.
- Opening and closing positions — closing a whole position, splitting, expiring, and bulk close.
- Automating a position — the Rules tab in full.
- Risk Lab — the same risk panels across your whole book, with what-if sliders.