
Intraday
The Intraday screen is a live, second-by-second chart of the session, built for 0DTE. It plots where the underlying is trading against the market's expected move for the day, so you can see whether price is drifting toward your short strikes. Open it from Market View.
Important
The expected move is an estimate: a range implied by today's option prices, not a prediction of where the underlying will go, and price can and does move beyond it. VolNinja never gives trading or financial advice. Treat the bands as guidance, not direction: context for your own decision, never a recommendation to trade, a guarantee, or an opinion on what you should do. Every decision is yours.
The selector at the top right of the page chooses which underlying you're charting: SPX, XSP, SPY, or QQQ. The title follows it (SPX Intraday, QQQ Intraday), and VolNinja remembers your pick for next time. The list only offers symbols that have a series for the day you're looking at. VolNinja records a chart while an underlying's chain is live, so a symbol you didn't trade or watch that day won't appear. Pick a day with no series and the chart says so rather than drawing an empty grid.
What the chart shows
The chart plots three series over the trading day:
- Price (blue) — the underlying's path through the session, read on the right axis.
- Expected Move bands (green) — the range the options market is implying for the day. The dashed lines are the 1× expected move (the underlying's price ± the at-the-money strangle price); the dotted lines are 2× that move. Horizontal reference lines also mark the price, EM, and EM×2 levels on the axis.
- OTM Options Sum (pink) — a running total of out-of-the-money option premium, on the left axis; it generally trends down as premium decays through the day.
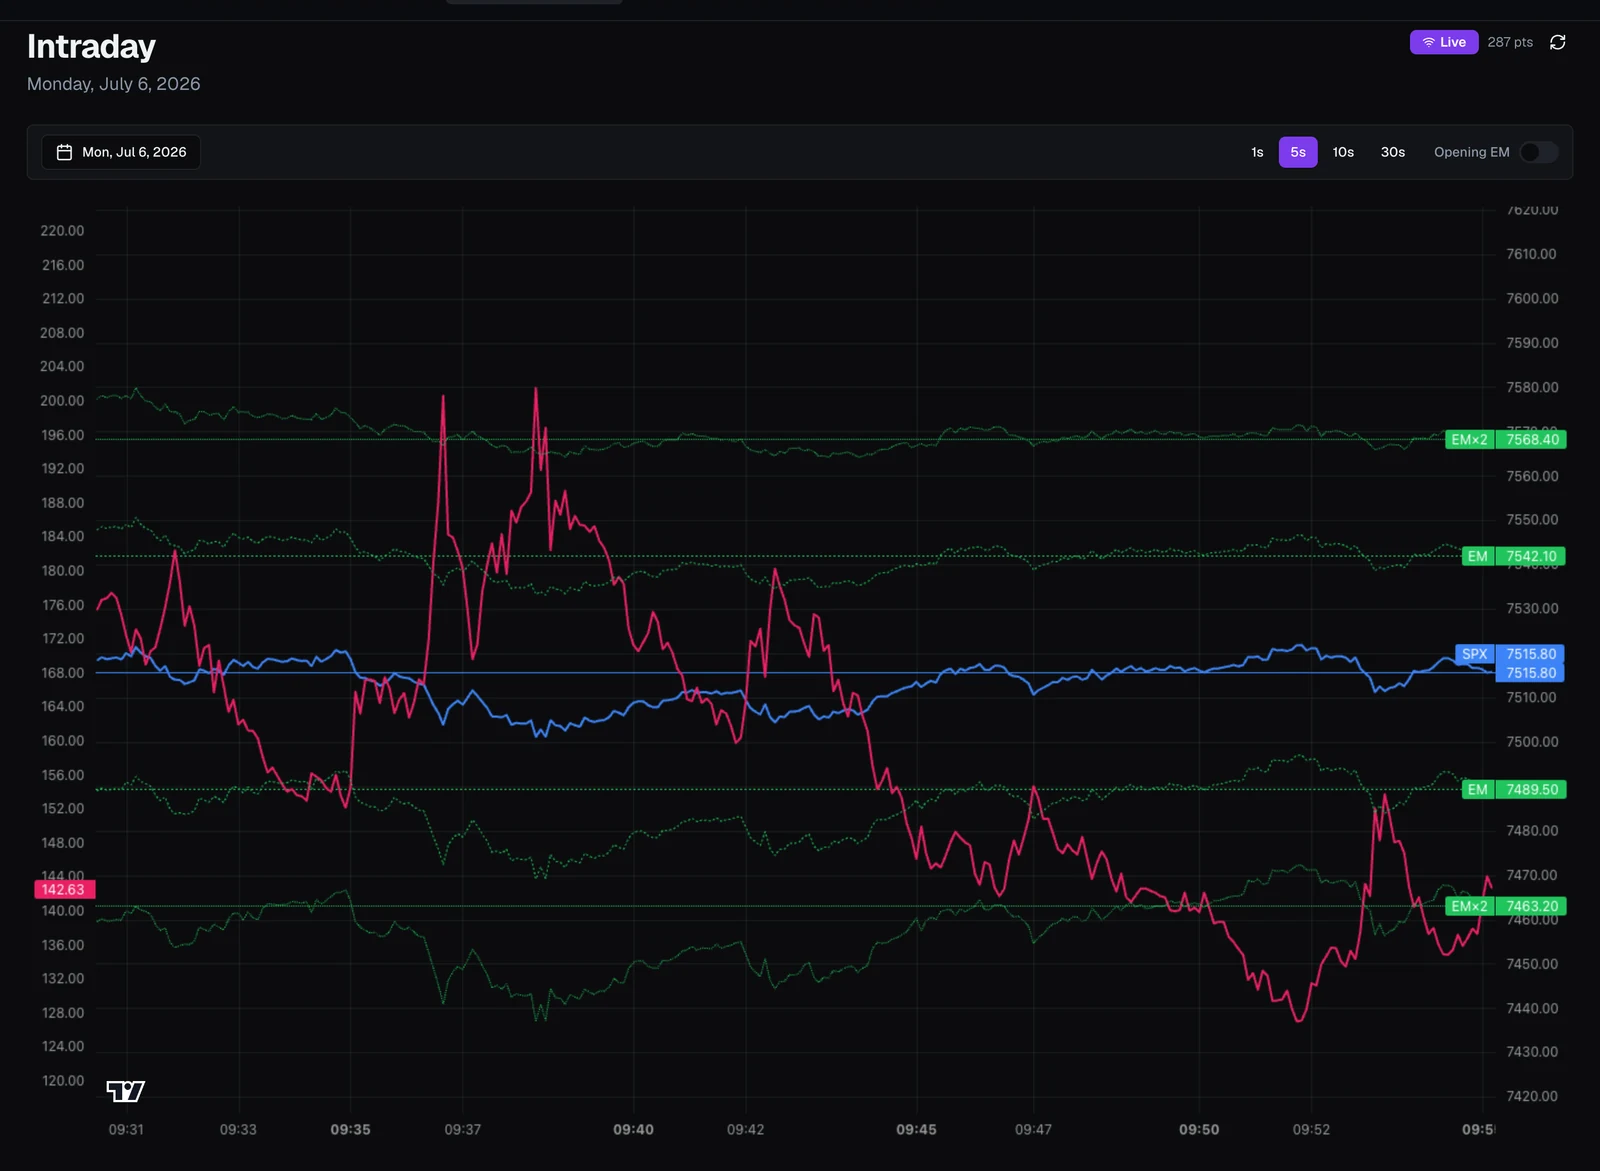
Hover anywhere on the chart to read the exact values at that instant. A tooltip shows the time (ET), the underlying's price, the OTM Options Sum, and the EM×1 and EM×2 ranges.
Tip
For 0DTE, the expected-move bands are your visual guardrails. While price stays inside them, your short strikes are out of the money; a press toward a band is your warning.
Opening EM vs current
The Opening EM toggle changes what the horizontal reference lines anchor to:
- Off (current) — the lines track the current expected move, recalculated as the strangle reprices through the day.
- On (opening) — the lines lock to the opening expected move, so you can see how far price has traveled relative to the range the market set at the bell.
Live today, or review a past day
By default the chart shows today, updating live. While you're on today, a small connection icon in the top right shows whether the chart is streaming; if it turns red with a crossed-out signal, the chart is showing the last data it received. Hover it for the wording.
To review another day, pick it from the date picker beside the underlying selector; the date under the title follows. You can go back about a week (weekdays only). Because each underlying is recorded separately, changing the date can change which symbols are on offer: if the one you were charting has no series that day, VolNinja switches you to one that does.
A chart day is the session that trades toward that day's expiration, and it rolls over to the next day at 4:00 p.m. ET. For SPX, whose options also trade overnight, that means the session which starts the evening before belongs to the next day's chart.
During regular hours the chart shows the regular session (9:30 a.m. – 4:00 p.m. ET), with the first few seconds after the open trimmed to skip the noisy rotation at the bell. Past days show the regular session too. Before the open and after the close, today's chart shows everything recorded for the day instead, so there's something to look at. Turn on Show overnight at any time to see the whole recorded day, including the overnight session on underlyings that have one.
Resolution
The 1s / 5s / 10s / 30s buttons set how finely the session is sampled. 5s is the default. Drop to 1s for the most detail, or step up to 30s for a smoother, lighter view.
To see the strikes behind these levels, open the Options chain; to stress-test a position against a move rather than watch one unfold, see Checking risk.