
Options Chain
The Options Chain is your live view of the 0DTE market: every strike VolNinja is watching, with real-time prices and Greeks, and a clear read on which options it's streaming. Open it from Market View.
Pick which market you're looking at from the selector at the top right: SPX, XSP, SPY, or QQQ. The header follows your choice (SPX Options Chain, QQQ Options Chain, and so on), and so does the market strip beneath it. VolNinja remembers your pick, so the chain opens on the same market next time. The Dashboard keeps its own, separate choice. The expiration doesn't change: the chain is 0DTE only, always today's expiration, shown as 0DTE – <today's date> under the title.
Read the grid
The grid puts Calls on the left, Puts on the right, and the Strike down the middle. For each strike, each side shows:
- Bid and Ask — the current market.
- Δ — the option's delta.
- IV — implied volatility.
- Status — whether VolNinja is streaming live data for that option.
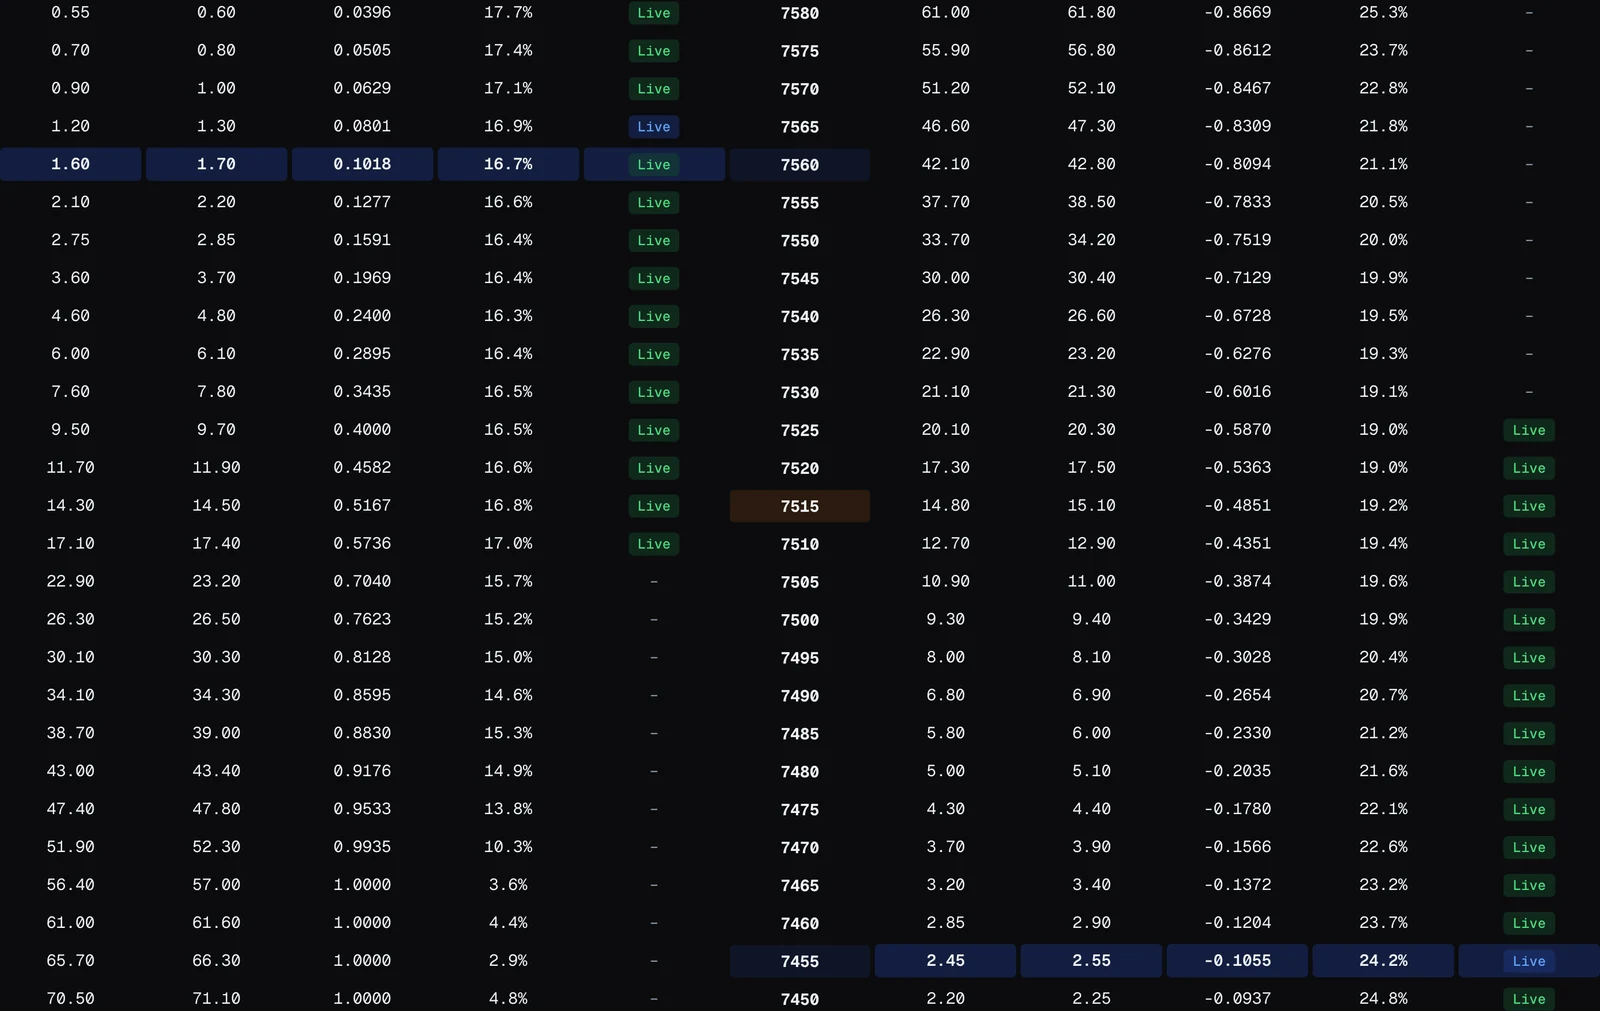
The grid highlights two things for you: the strike nearest the current spot (at-the-money), and the call and put closest to ~0.10 delta, common short strikes. The chain lists only strikes that currently have a live market, so far-out strikes with no quotes never appear and the grid stays on the active part of the chain.
The Status column — what's streaming
The Status column tells you whether VolNinja is receiving live data for each option:
- An age, such as "12s" — not streaming live; the prices shown come from the most recent snapshot, taken that many seconds ago. Past 60 seconds the age turns amber: a quote that old is one VolNinja itself won't trade off. Hover it for the exact age.
- "–" (gray) — not streaming, and no recent snapshot quote either.
- "Live" (green) — subscribed and streaming, and it isn't part of any open position.
- "Live" (blue) — subscribed and streaming, and it's a leg of one of your open positions.
- "Live" (red) — it is a leg of an open position, but it's not subscribed: you're holding something with no live data on it.
Blue is the expected state for options you hold. Red is the one to act on.
The live-data line budget
Your Interactive Brokers account allows a set number of live market-data lines at once, 100 by default. VolNinja shows how many you're using in System Status at the top of the app, as an "N/your-limit subs" readout. A count at or near your limit is normal: VolNinja deliberately spends spare lines on extra live coverage. The Data pill beside it is what tells you whether live data is under pressure; see System Status and data health.
You rarely manage this by hand. VolNinja subscribes automatically: your open positions and working orders first, then the strikes around your strategies and the broader market, rotating the rest as prices move. The Status column and the System Status readout are how you see that happening. To read how VolNinja decides what to stream, and to set your real line budget, see Market Data & Subscriptions.
Important
The line limit comes from your Interactive Brokers market-data subscription rather than from VolNinja. It's 100 by default, and you can purchase additional lines from IBKR in 100-line bundles. Whatever your limit, if every leg you care about shows a green or blue Live, you're covered. A red Live on an open position's leg, or a Data pill reading Thinned, Degraded or Impaired, means live data is stretched thin.
Tip
The Options Chain is for reading the market and checking your data coverage. You don't place orders from the grid; to open a trade, run a template or use Quick Execute (see Placing a trade).
To see how a position built from these strikes is doing, head to your Positions overview; to pressure-test one before you commit, see Checking risk.