
Reviewing Your Results
The Performance screen shows how your trading went over any stretch of time: a single day, a week, a month, or your whole history. From any day you can drill straight into the trades behind it.
Everything here reflects the mode you're viewing: Paper for your practice results, LIVE for your real account. See Paper vs live.
Choose a period
Open the Performance screen. The bar at the top sets the window you're looking at:

- Quick presets — one click for the common ranges: 7D, 30D, MTD (month to date), YTD (year to date), and 1Y.
- Opened by — count only the positions a given source opened: Unassigned (positions no strategy owns: templates you ran yourself, trades placed through the API, and positions you recorded) or any of your strategies. Tick as many as you like; the button shows the first one and how many more (for example "Morning entries +2"). A strategy you've since deleted still appears here, as Deleted strategy, as long as positions it opened remain. Leave it on All positions to count everything.
- Start date / to / End date — pick an exact custom range from the calendars.
- The ✕ clears your filters; Refresh pulls the latest.
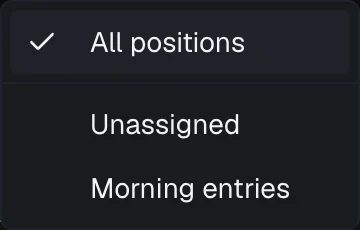
With no range set, the screen shows your entire history.
Read the scorecard
The cards across the top summarize the whole period you selected. Four larger cards lead, answering "how am I doing"; the rest sit in a denser block below them. Hover or tap a card's label for a one-line explanation.
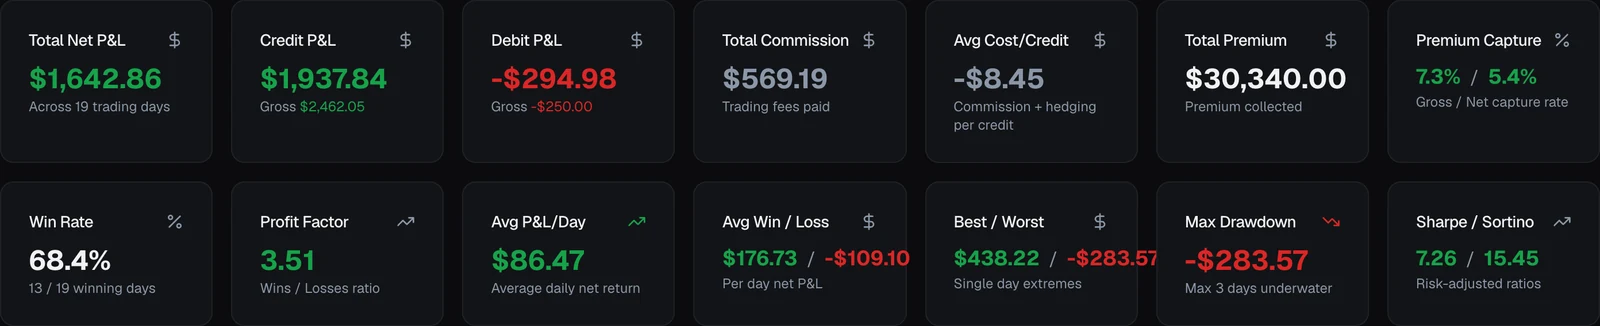
The lead four:
- Total Net P&L — the bottom line for the period, after commissions, across however many trading days it covers.
- Win Rate — the share of winning days, with the count beneath (for example "12 / 20 winning days").
- Avg P&L/Day — your average daily net result.
- Profit Factor — gross wins divided by gross losses (above 1 means the winners outweigh the losers).
The detail block:
- Credit P&L and Debit P&L — your net result split by trade type, each showing the gross figure beneath.
- Gross Capture and Net Capture — the share of collected premium you kept, before and after commission.
- Avg Win and Avg Loss — your average winning and losing day, net.
- Best Day and Worst Day — your single most extreme days, net.
- Total Commission — fees paid.
- Total Premium — premium collected.
- Max Drawdown — the deepest peak-to-trough drop in your cumulative net P&L.
- Days Underwater — the longest run of trading days spent below your previous high.
- Avg Cost/Credit — commission and hedging cost per credit trade.
- Sharpe and Sortino — risk-adjusted return ratios. At or above 1 shows in green, below zero in red. Sortino only counts downside swings against you.
See the shape of it
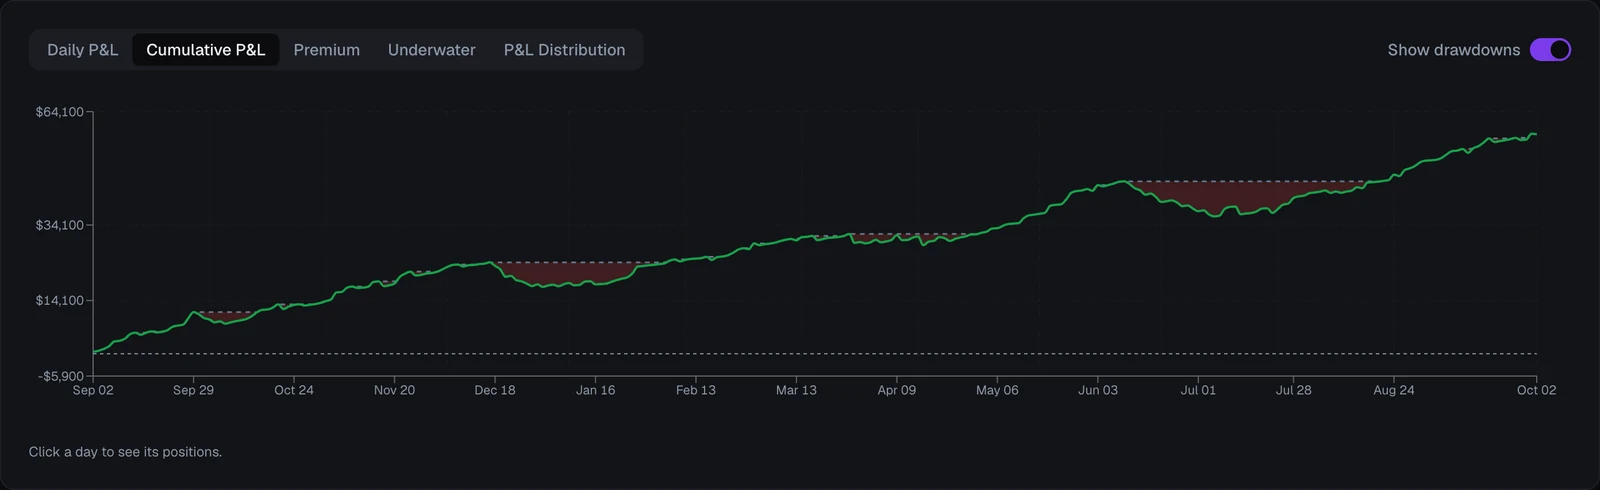
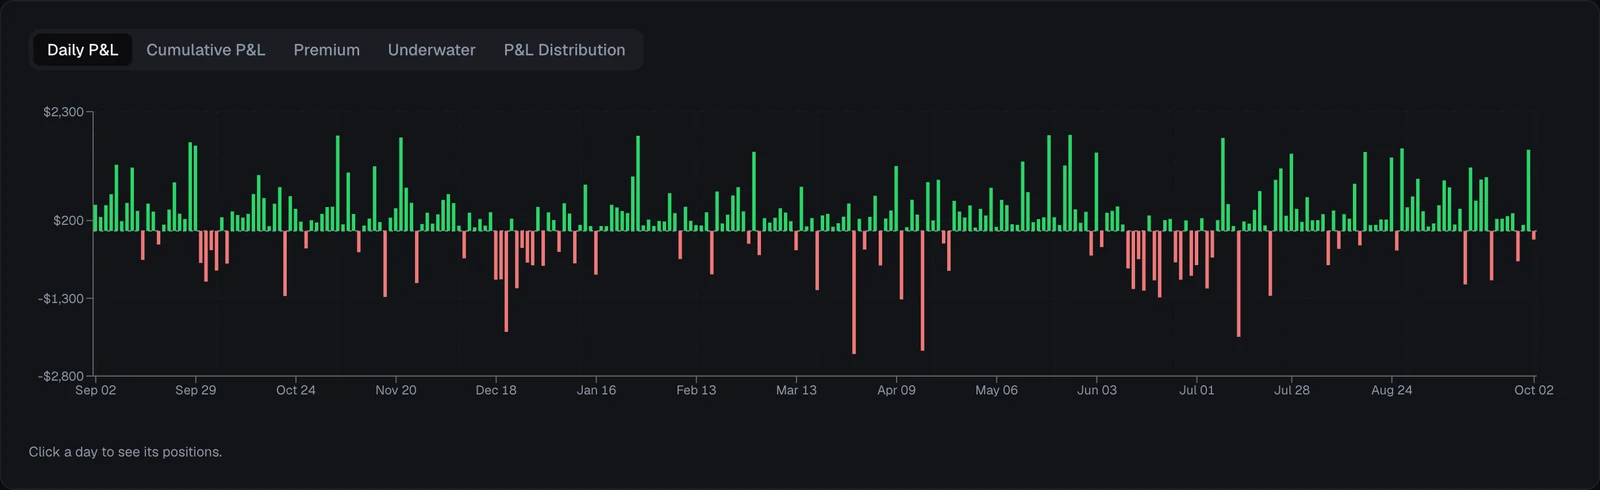
Below the scorecard, tabbed charts plot the same numbers: Daily P&L, Cumulative P&L (with an optional Show drawdowns overlay), Premium, Underwater, and P&L Distribution. Use them to spot streaks, or a drawdown deep enough that no single number shows it.
On the Premium tab, the Avg per credit position switch changes each bar from the day's total premium to the average premium per credit position. That puts a busy day and a quiet one on the same footing.
On every chart except P&L Distribution, you can click a day (a bar or a point) to open that day's positions. See Drill into a day's trades. The distribution chart has no single day behind each bar, so it doesn't drill in.
Go day by day — or month by month
The Performance Data table at the bottom breaks the period down, with Monthly and Daily tabs. It opens on Monthly.
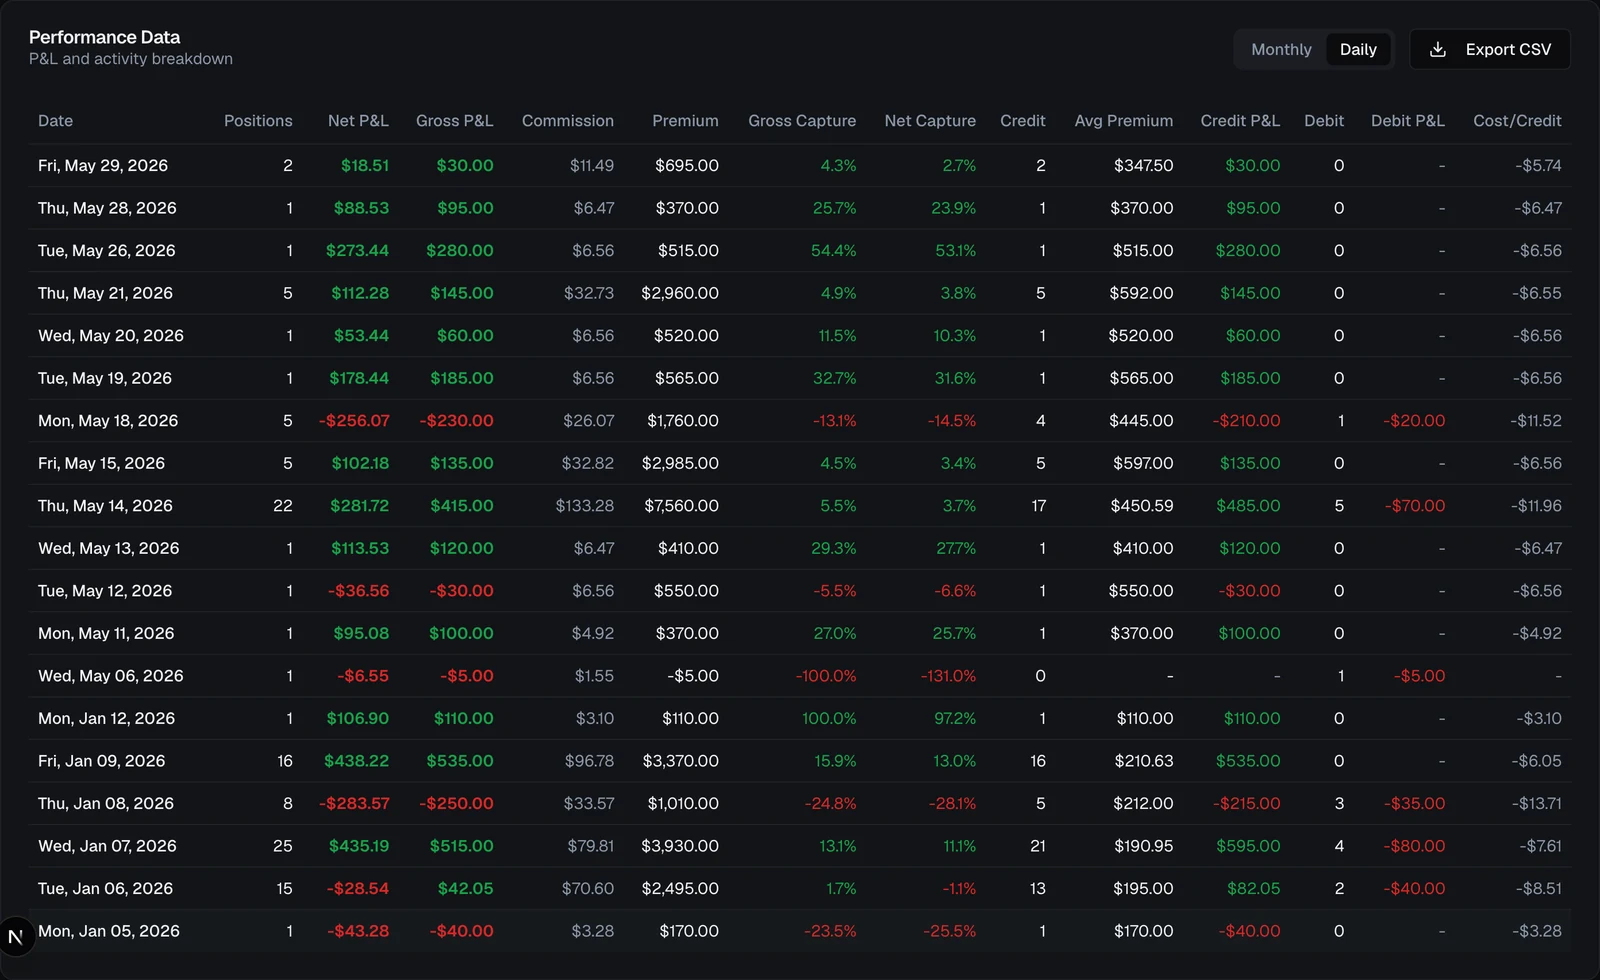
Switch to Daily to see every trading day; Monthly rolls those up per month with extra stats like win rate and average per day. Export CSV downloads whatever the current tab shows, so you can keep your own records or analyze them elsewhere.
Column headers are abbreviated so the whole table fits: Pos (positions opened), Net, Gross, Comm (commission), Win %, Prem (premium), Cap % (capture), and so on. Hover a header for its full name. Click any header to sort by that column; click again to reverse the order.
Drill into a day's trades
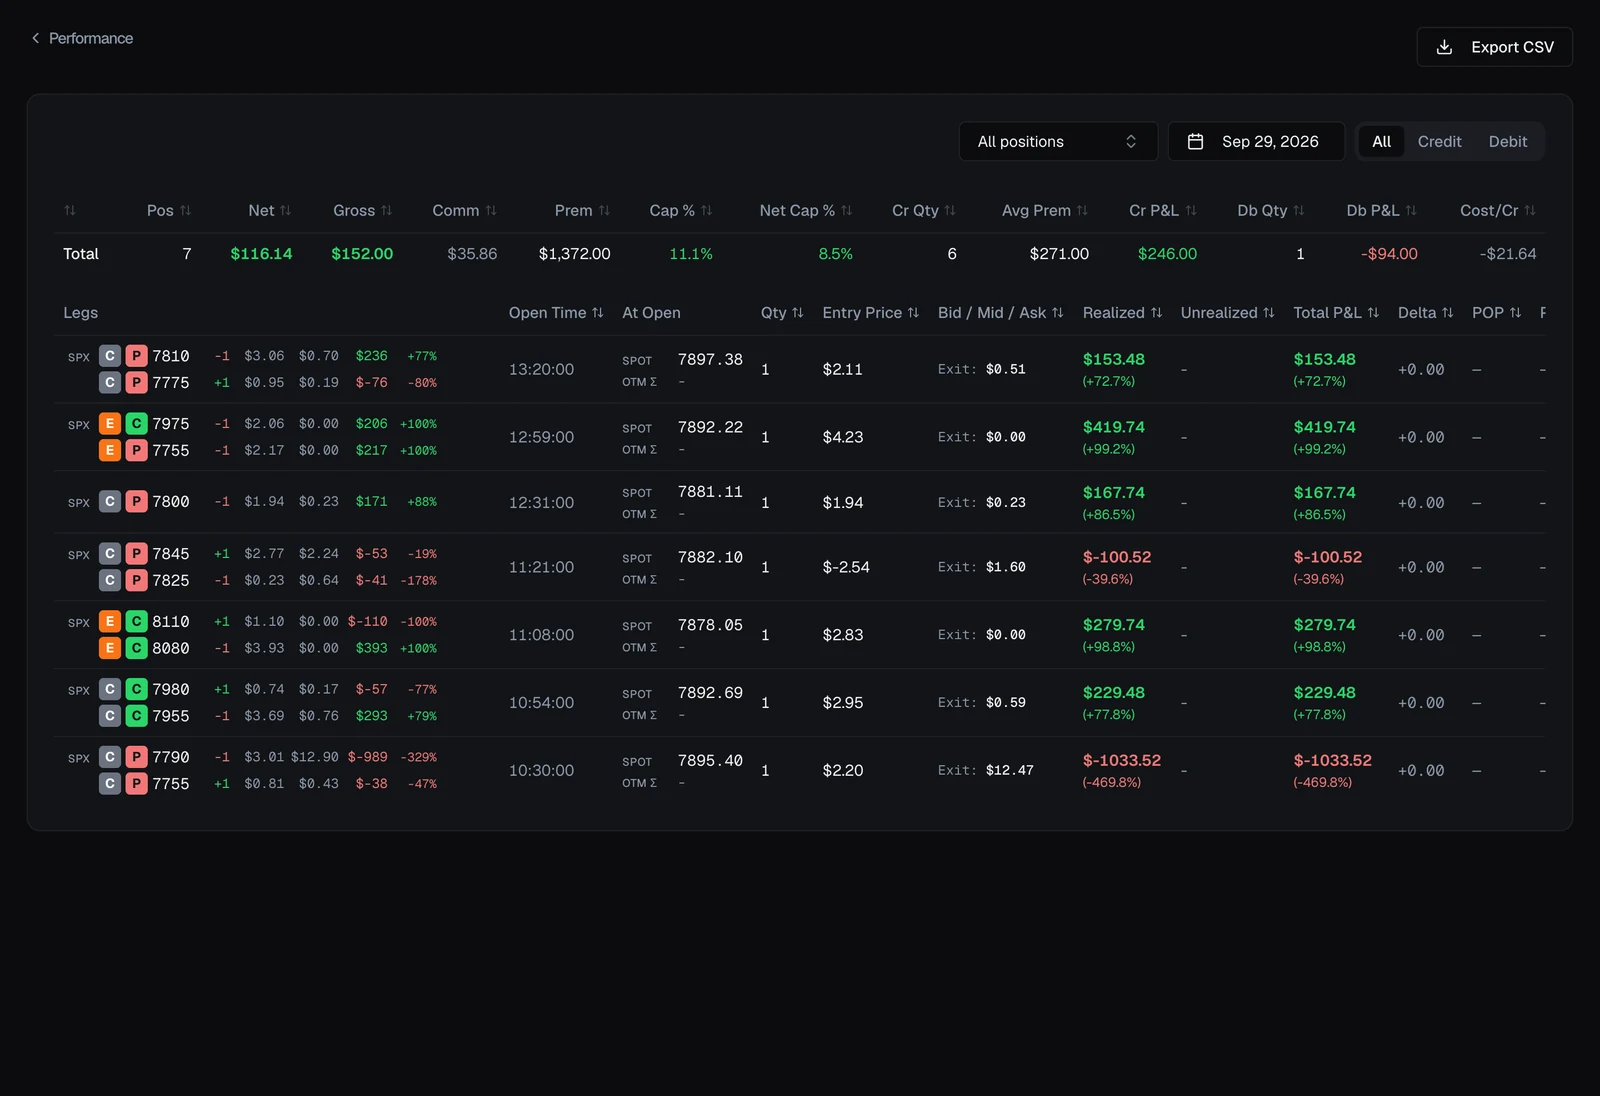
The table shows which days went well or badly. To see why, click into one: on the Daily tab, click any day's row (or click a day on one of the charts). VolNinja opens a page listing the positions that made up that day's result. Your Opened by choice carries over, so if you were looking at one strategy, you see only its positions.
The day's page has:
- A ← Performance link back to where you were.
- The Opened by filter, a date picker to jump to another day, and All / Credit / Debit tabs to narrow the list by trade type.
- A Total row with the same columns and numbers as the Performance table, for that day.
- The day's positions in a sortable table. Click a position to open its details sheet with its legs, P&L and activity.
- Export CSV, to download the list.
Tip
To review a specific day fast: switch the table to Daily, click the day, and open any position on the page that follows to see its legs and P&L. See Position details.
Important
These figures are for the mode you're viewing. Reviewing in Paper shows your paper results; switch to LIVE to review your real account. If a number looks wrong, first check which mode you're in. See Paper vs live.
To pressure-test a position before you commit to it, see Checking risk before you commit.